Friday, April 8, 2011

Another Failed Auction Revisit


Nifty Future once again visited Failed Auction price, now price action near 5850 decides next course of action.
Will write in detail about research i did on Failed auction.

Tuesday, March 22, 2011

Failed Auction -Revisit


Few days back posted about failed auction ,what does it mean and possibility of revisit of failed auction prices in next 5 trading days.
You can read that post here

http://mercurycapital.blogspot.com/2011/02/failed-auction.html

I have marked failed auction on chart on 17th Mar,now lets see if market revisits 5528 within next two days, if there is no revisit one can assume that there is more downside.

Here is weekly profile,

As visible market is still below Value area, if it can cross 5450, then its quiet possible to revisit failed auction n may b more upside.
so looking at charts, Buying 5500 CEs with 2-3 days time frame makes sense to me.

Trade wisely!! Happy Trading :)

Monday, March 14, 2011

Normal Variation Day

Updating blog after many days, as Nifty was rotating alot n i had nothing much to write about it.
Anyways today NF Broke out of Balance it was forming for last 3-4days.
Today im going to write about points i observe throughout day, as im
discretionary Trader..i have to be in sync of market n understand whats it doing n how efficiently its doing that job??Mentioned points on chart, changing my charting Platform to Ninja Trader( lately Market Delta Creating lot of problems in data handling,still managed to add MD TPO chart )

Most imp. point for market is OPEN, as open tells us which side overnight Inventory was and then if market sees follow up on that side of Inventory.
  • Friday Market tried to break down n in second half manged to recover..n today market open was on that side i.e.UP
  • Open Inside YVA= suggesting nothing much has changed overnight
  • Open Type= Open drive which has strongest conviction of all the open types.
  • Then next step market crosses YVAH..imp ref point n saw follow up of this buying also, in this process mkt spent Nearly 2 hours rotation in same region but IB high was holding, leaving no case for shorts.
  • so far not any point suggested shorting markets, then in "K" period mkt finally moved away from balance it was forming for 2 hours on upside, breaking 2 days high, managed to close @ Highs.
  • creating Normal Variation day, where target is generally IB X 2 or 1.5, which was hit.
  • For tomorrow  we may see follow up of today's action ..ref point on upside is 5575-5620. 5540-5530 should hold for any up move.
 Today i was in total sync of market, n due to all these pointers was long from the start of day (around 5479) , Thanks to Market Profile :) .

All Comments welcome.


Thursday, February 24, 2011

Double Inside Day

Range is getting narrower, leaving us with double inside day or as some people call it Dynamite Pattern.Move on either side will be rewarding, till then its rotating markets, where one should be looking at Responsive Trades.
Tomorrow is Expiry day and on 28 its Budget, so because of this event there is nervousness in markets.
Creating strategies for Budget.. whether Budget will be non event for markets or will be major event ??
Have a look @ March Options Table


No major clues from that too , indicating same range NF trading in now.
However Open interest in Puts is more than calls , 5400 PE has maximum OI in all strikes, which is nearly 21lks higher than maximum OI from Calls i.e. 5500 CE. So is it pointing on Rally after Budget ??


Sunday, February 13, 2011

Failed Auction ?


Did NF saw Failed Auction on downside on Friday ??
Whats Failed Auction= Its Single Prints at one end of Profile after Initial Balance but then Range Extension at the opposite end.
As its visible on chart, NF had Failed Auction in "F" Period and Range Extension on opposite side in "I" Period.
If market holds failed Auction Price, NF can head for some good UP move or at least  some rotation.
(I understood this Failed Auction Term from Barros Blog.. )
Here i would like to share what he mentioned about Failed Auction :-
"Market Profile Theory suggests we ought to see a Failed Auction’s price within 5-trading days. The fact that we did not, will suggest that the market has more Upside." ( which is honestly very New to me )

Now im curious to see Action Near Previous Failed Auction on Upside on 7th Feb "K" Period i.e.5445 ( 14th Feb will be 5th day ) :)

All Comments are welcome .


Sunday, February 6, 2011

Divis Lab

Stock looks positive, can enter with stop of 643..Trgt 665-680.

Freefall in Markets !!

Nifty Fut Chart with Open interest and VIX..all notes on chart.
and here is Nifty Options table...Hugh addition  of Oi and with increase in volume @ 5300 calls and on Puts  5200 seeing lot of action.


Wednesday, February 2, 2011

Head n Shoulder Pattern

Head n shoulder  Pattern visible on Daily charts of Nifty Future, on 28th Jan Neckline got broken on downside.Neckline  stands @ 5575 ,so  below that its down side only ..targeting 5090. To negate this pattern NF needs move above 5575..

Sunday, January 30, 2011

Price Reversal after Expiry + 1 Day ???

Today while studying Nifty Future chart ,observed something interesting ..that after Expiry, first session of new series the move is generally continuation of earlier direction  but on the second or third day there is Reversal !!!
On chart i have pointed expiry days from to Sept 2010 to Jan 2011..in all occasions NF continued its direction on first session but reversed from next 1-2days.. :D
It can be coincidence, or may be not ..who knows ??
Here im not predicting or forecasting anything but only sharing what i have observed on charts..


NF Bigger Picture


Lets charts do all the talking !!

Monday, January 24, 2011

" P " shape Profile


Today Open Type was Open Auction and then IB Breakout alerted for possible trend day development, however NF couldn't sustain at high of 5759.50 which happens to be high for last 6 days. shape pf Profile looks like  'P' which is sign of short covering, for any strong upmove we need new longs now else  down trend can resume anytime.
On daily charts POC shifting  higher which is bullish but close above 5750-60 is needed for any clean move up,otherwise this zone will prove major resistance ahead.
Tomorrow is RBI policy, so trade wisely as volatile session expectd.
Stocks - Educomp and Union Bank Can be traded with positive bias.

Thursday, January 20, 2011

Strong Bounce - Another DD Day


On profile i have marked previous clusters.Market saw strong responsive action near low created on 14 Jan.Open was strong today ..looks Open drive but that didn't see  follow up in D period n got sell off,tested lows n then strong move into Yesterdays VA..n we saw 80% VA Rule by hitting  nearly YVAH.
Now move ahead depends on how we trade near these clusters, and its also important to see how we open relative to today's rally.

DD Day

As yesterdays post titled  Neutral extreme Day..i was expecting to see follow of last hour up move but clearly market struggled a lot to cross VPOC level mentioned of 5746.For most part of day 5710 level held..so VA developed overlapping higher but second half saw heavy sell off n nearly hit 17 Jan Vpoc 5662(nowadays we are seeing this very often hitting both sides VPOC i.e. extreme volatility.) and moved back closing @5698 so developed day type was Double Distribution Day.Today's low 5660 holds key for any side move now.
Today i was  away from market after 11am..was holding Bull Ratio spread and had no idea of fast reversal now my position clearly needs some rework tomorrow.
Today's Profile

Tuesday, January 18, 2011

Neutral Day Extreme - Continuation Likely

Today NF Opened above YVAH, moved sideways for most part of day breaking IB low n then again moved back into IB ..Buyers n sellers were in Balance. Finally Buyers entered and managed to close near days high.
This is Neutral Day Extreme type in which one side wins i.e.Bulls today and this move likely to continue tomorrow.
5748-50(5746 VPOC of 14 Jan) needs to cross for any upside of 5780-90.
5690-5700 needs to hold.
I'm expecting Value Area to develop higher tomorrow, so for that 5700-10 most probably will hold.More after market Opens..!!!
Stocks to trade with positive bias - Orchid Chemical CMP 302 ..SL 295 Trgt 320-330.
Happy Trading.. 

Monday, January 17, 2011

Normal Day

This was all days activity-Nice balanced profile.NF opened below Fridays range but managed to close flat-doji on daily chart (Indecision).
NF formed wide IB of nearly 60 points..tried RE above IB in "H"period but got rejected n finally closed inside IB @ POC.
so finally bears are on Pause mode.
Now going forward if today's low of 5627-5610 holds, can see  some upmove..levels to watch above 5710-5715 are 5780-5830.
On the other side if this balance breaks on downside, then we can see fast down move as it will be initiated by new sellers.

Sunday, January 16, 2011

Finally Breakdown !!!

NF finally broke level of 5700 ,which was held for nearly 4days.
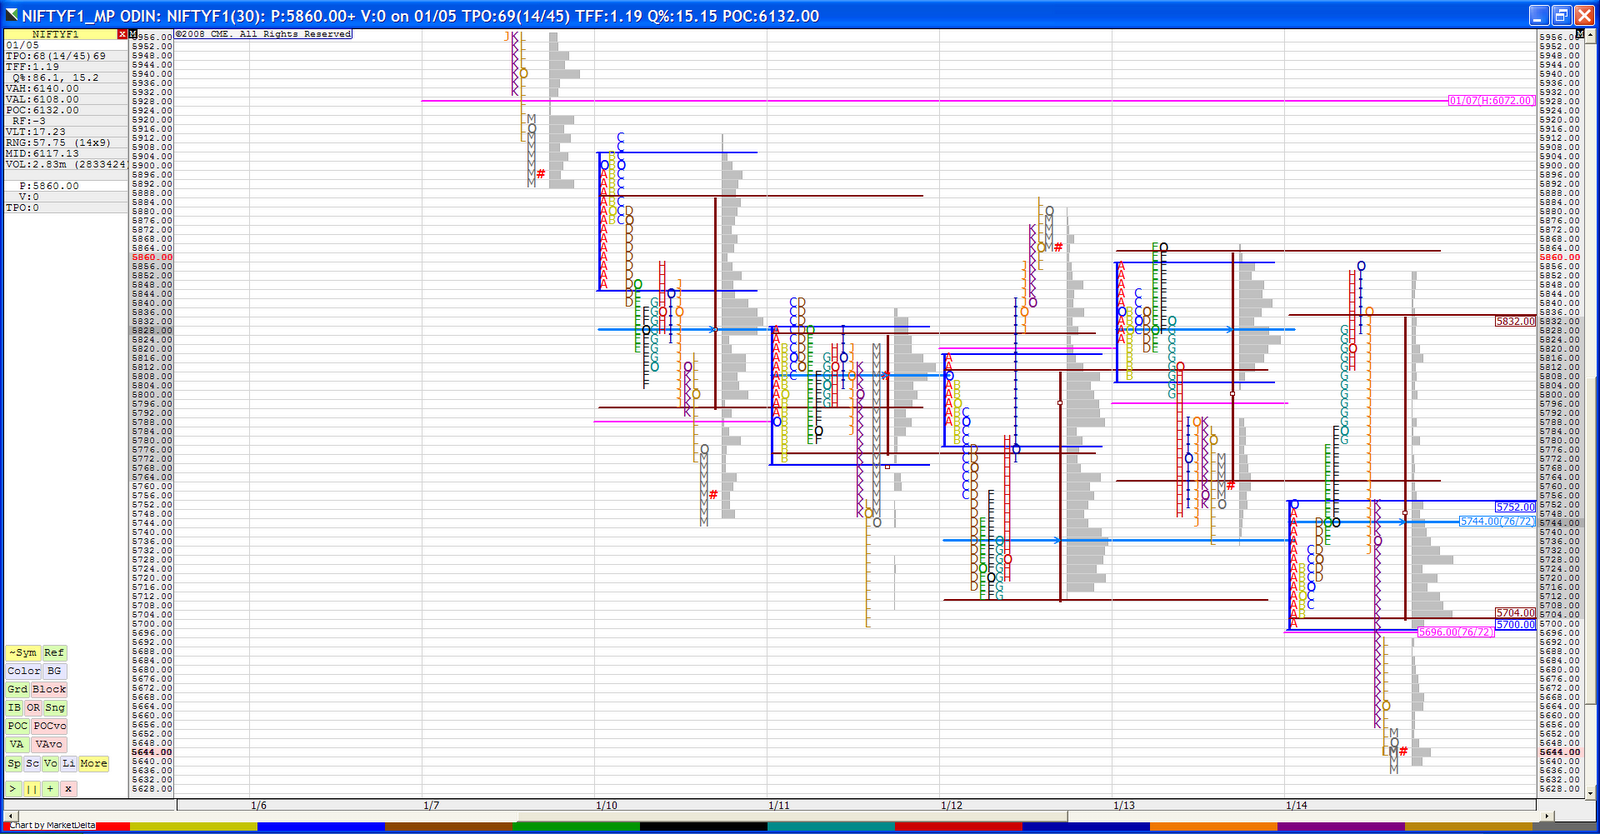
Here is MP chart with every period split , to see how fast market reversed from its direction to close near days low.
NF opened weak, below previous Value area,n later broke IB raneg to upside to hit YVAH of nearly 5860, rotated there for 3 periods, giving impression as if Double Distribution Day was developing, but in "J" period it quickly Rejected DD Day to hit days low, n finally made weekly low.
closed near days low,after strong initiative selling below 5700.
Picture looks very bearish now.
Here is another chart with NF volumes n Open interest (weekly).
Volumes were very high, nearly highest after 10July 2009,(Downthrust Bar???-next bar may give confirmation ) and Open interest increased nearly 110% over past week.However Open interest is not extremely high as compared to volume increase. so is there some profit booking in shorts ??? 
Option OI ..saw OI cut  in puts
5700 Puts = -6.59% /  5800 Puts= -25%  / however 5600Put= +10%n 5500 Put=22% added Oi.
In calls important level of 5600 added Hugh Oi = + 82% but 5900 CE= reduced 11% Oi..profit booking ??
Important level to watch on downside next weeks are 5610-5565. On upside 5695-5750.
Lets see how market trades on Monday some recovery or continuation of fall ? i think markets may see some recovery may be after some down move..

Friday, January 14, 2011

India VIX heading for Breakout ??


In this daily NIFTY FUT chart with VIX, as we know there is inverse relationship.Vix is near top of range (24 Sept 2010-high 24.68).Looking at chart and trying to get possible  move based on VIX..from 24sept 10 NF made new lows and closed down for nearly 3 consecutive days , however VIX was moving down.But this time VIX is not showing any signs of coming down, so are we heading for VIX breakout- expect NF to go much down.Lets see if it gives BO or remains in Rectangle. Till then Observing  VIX will help.
NF closing below 5840-50 level for nearly 3days now ( except yesterday) ,does it indicate some more downside.Breakdown of 5700-10 level will lead to bigger fall.
As today we have inside day n lower volumes as compared to yesterday, so lets see what market has in mind ..either breakdown or reversal ??
On Options Open interest front Calls adding Hugh OI
5700 CE = 28%
5800 CE = 33%
and 5800 PE = - 7%
       5900 PE = - 13%, & 5700 = 9% ( OI added )
So 5700 Level needs to hold for any upside, else markets heading for big fall.


Wednesday, January 12, 2011

Again Extreme volatile Day - Double NV day ??

Today's Profile ..charts speaks it all..what a volatility!! After weak IIP data market saw steep fall made low of 5711..and then rotated there for nearly tow hours D/E/F/G period low was 5711-12..finally giving upside break, moving away from previously formed Balance areas,closing near days high.
such days are rare , as had RE on both sides, hitting 200% of IB range ..so can we call this day Double Normal Variation day ?? Will discuss with fellow MP traders.
Notes for tomorrow,
Move away from last 2days balance area 5780-5834 (12 Dec) and 5827-5855 . so if 5850-5860 levels hold we can see some more upside.
Levels to watch on upside are 5927-5960.

Tuesday, January 11, 2011

Volatile Session !!

Today Nifty opened within yesterdays Value area and remained sideways for most part of day.It was Normal day till 2.30pm within  Range of 5840-5780, getting reaction near YPOC level of 5830 it couldn't cross it decisively and later got range extension to the downside till 5700. 100 points down in half hour and immediate  fast rebound of 100 points to 5807  ..finally closing within Value area@ 5807.(settlement price is 5770).
Creating Normal Variation day which hit Range extension target of IB X 2 
Premium for NF increased from 3-4 points to 54 points (as per settlement price of NF its 16 points) ..extremely volatile day !!
Here is today's profile,
Day Type = Normal Variation Day
Shape looks like "P" indicating short covering.
So for any upside need decisive break of 5830-40 then we can see move to 5880-5900.
Lets see how market unfolds tomorrow. 

Stocks: ACC  mentioned earlier post did well..almost hit 1040 ( high 1042) closed @ 1029.Looking positive.

Monday, January 10, 2011

No space for Bulls to Hide !!!

Nifty Fut closed today @ 5766 after breaking  major support of 5820.
This down move is very fast ,nearly loosing 7% in just 5 days
(5% in last 2days ).
On daily NF charts candle pattern looks like 3 BLACK CROWS , one of  Reversal pattern where three black candles appear consecutively, each one opening within the body of the other and closing at a new low,
Reflecting increased bearish strength.
Now supports to look at are 5720-5660.Not sure whether support levels  will hold or not.

Today only stock closed with strength is ACC.If tomorrow market get bounce it can b bought with stop of 1006 ..Trgt 1035-1045.
It might not sound very good idea to look for buy now..however we should have our stocks picked in case we see any technical bounce. 
charts for reference,

Sunday, January 9, 2011

Nifty Review

As title of 6th Jan NF update said- "b"shape long liquidation ??  Bears took control form the open of market, with no support coming from responsive buyers NF  closed 2.6% down with above average volume.Fall is too much too fast. Now whats next ?? I have marked Trend lines on chart.
In Market profile terms last week NF made overlapping higher Value area but closed well below last two weeks low.Very bearish,Hitting 3 VPOCs on the way down. @-)


Lets see on Monday, how market opens n whether it  continues its move down or get some Bounce to 5940-5960.
If we  see some recovery, stocks to watch are,
Bank of India @ 450 +1.6%(chart in earlier post ), Bank of Baroda @848 +1.2% are stocks which closed positive.

About earlier stock chart posts..ABAN hit stop loss of 772 on closing basis.

Friday, January 7, 2011

BOI

Bank of India daily chart...CMP 456..looks Break out..but do check today's close.

About Bull call Spread proved out to be on wrong side..did some adjustments to it.

Open Update

NF opened within Value area and Range..so looks balanced.
Open type looks Open Test drive ..opened 6064..tested Yesterdays VAL n turned around.
As mentioned im in bull call spread ..today likely to form range..Buy low..sell high strategy may work. i.e.Trading range 6050-6070-6080.

Happy Trading !!

Thursday, January 6, 2011

' b ' shape - Long liquidation ??

Nothing much to post now as 3pm update covered all days action.
Profile shape looks like " b" today (yesterday was " P" :) )..does that mean longs getting liquidated..
Attaching Profile chart..inset is one of the contra trading system snapshot.. based on that i have created Bull Call spread today. sounds adventurous  ??? dunno..Risk : Reward looked good.
 Lets see tomorrow, how market opens.

Nifty Fut ..3pm update

Here is today's profile.. every period separated to give clear picture ..looks trend Day so far..each period made new low..however now Nf trying to move up..creating SP in " J" period..and "K" period made high than I n J period..
Now price behavior near POC 6077 is key and crossing H period high 6083..can take  NF to 6115.
Taking longs here or creating Bull spread makes sense to me  ... take ur decision wisely . :)

Open Update

NF opened within yesterday Value area n range..balanced day likely ..range can be 6130-6090.

Wednesday, January 5, 2011

' P ' Shape profile

Yesterdays Neutral Day extreme proved out to be right as we saw continuation in down side.
 After gap down market rotated between 6140-6120 for most of time, then break down in afternoon session, to touch Single print 6093, again moved up n we saw rotation between 6090-6120.
Opening Type = open rejection reverse as market tested yesrtd known ref level 6150 n gt rejected
Day Type = Again Normal variation day.

Notes for tomorrow,
1) SP on lower side @ 6086
2) Profile shape looks like 'P' shape..kind of skinny at bottom , so information suggesting may be short covering happened.
3) VPOC @  6080 on downside..so may be we get to see some support there, as VPOC acts as price attractor or Reversal point.
If broken, ref lvl to watch on downside are 6060-6035.

Open Update

Nifty Fut Open out of Value area and out of Yesterday Range..clearly  imbalance.
Open is Open test drive..likely to have some more pain. Ref lvl to watch is 6154.

Reliance

Stock I'm watching today is BIG BOY...Reliance.
Yesterday stock closed up 2% with little change in Open interest, up 1.10%. Most active options of RIL are 1080 CE LTP@ 24.90, 1100 CE LTP@ 16.35 and 1060 PE LTP@ 16.40.
One more stock to trade with  positive bias is PUNJ LLOYD LTP-116.65.

Tuesday, January 4, 2011

Another Day with Single Prints @ high


Today's Market profile chart, as mentioned in morning update Nifty Future bias as down ,it moved lower.But most selling was done in IB itself ,then saw strong responsive buying which made new high for day ..got strong rejection (creating SP on chart ) n closed near days low.

Opening Type= Open auction( open rejection reverse if we consider 6208 as traded price )
Day Type = Here i see two possibilities as shape looks like  i) Double distribution Day  and  ii) Neutral Day extreme.
However looking at wide Initial Balance ( 6198 to 6155) and as both IB high n low got breached, market closed at one extreme i will go with Neutral Day extreme.

Notes for tomorrow,
1) Again single prints @ high
2) VA moved lower
3) Day looks like Outside day ( Bear Engulfing Pattern)
Sounds bearish ? Lets c tomorrows open n Open confidence.
Ref level to observe are 6120-30 on downside.

Happy Trading !! 

NF Update

Open is within yesterdays Range n Value area..suggesting  balance markets.
Open looks Open auction with slightly negative bias.
More updates later.

Monday, January 3, 2011

Voltas

One stock idea for swing trade is Voltas.
Bullish bat pattern on stock, volumes supporting up move .
Buying here with Stop of 210.
Chart for reference

NIFTY FUTURE


Here is Market profile chart of Nifty fut.some points to note are small Initial Balance, NF rotated  with in small range. Range extension happened on down side and last two periods market saw some weakness.
Opening type = open auction
Day type= Normal variation day ..generally RE=IB X 2 which got hit.

Notes for tomorrow,
1)Single prints @ high,
2) Higher VA developed today  but closed within previous days range.
This information at hand  suggesting that may be NF entered stage 2..so rotational market is expected.Will update after tomorrows Open.

Saturday, January 1, 2011

ABAN Daily chart

Lets chart do all the talking !!!

Through My Eyes

This is my blog on stock market.Here i will share my stock picks , Nifty Future update , option analysis, which will bring profitable opportunities ..in short i will try to share whatever ( lil ) i know.

This blog is way to have more discipline n self control for me.
So now its time to take Plunge !!

HELLO WORLD !!!

Hello World !! This is my First post in First Blog on the very First day of year 2011 .